
 English
 Français
 Español
 Deutsch
 Português
 Italiano
 العربية
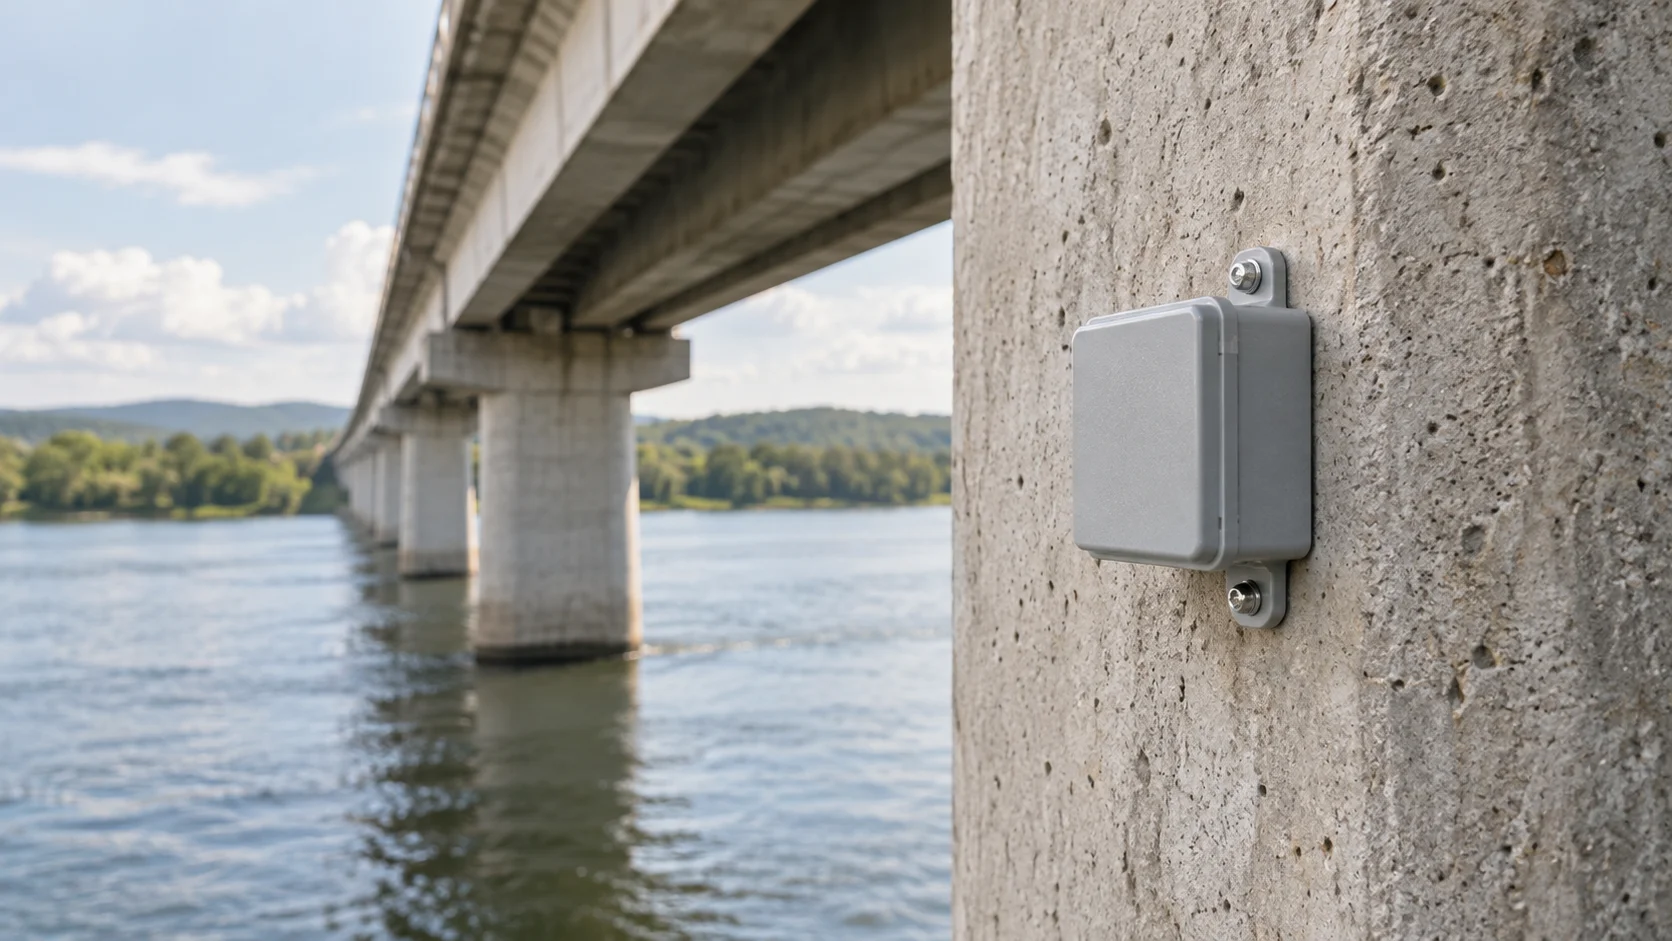
Automated bridge monitoring puts sensors on a bridge that measure how it moves, how its cracks behave, how it vibrates and how high the water around it rises, day and night. Software compares every reading with what is normal for that structure and notifies an engineer when something changes. It covers the years between an inspector's visits, when a flood can wash material out from under a pier, or an abutment can rotate a little further each season without anyone looking.
Below are the sensors worth measuring with, how they run on a bridge with no cables and no power supply, and how a stream of numbers turns into an alert the right person trusts. River bridges get extra attention, because the damage that worries engineers most happens underwater, during floods.
In short
- Bridge monitoring sensors measure tilt, crack width, displacement, strain, vibration, temperature and water level, and each one answers a different question about the structure.
- Wireless sensors run on batteries for years and send small radio messages to a gateway that can serve several bridges, so nothing is cabled along the deck.
- Temperature explains most day-to-day movement, so readings are compared with what's expected at the current temperature instead of one fixed limit.
- Flood monitoring pairs river level with pier tilt to catch scour, the erosion of riverbed material around foundations.
What sensors are used for bridge monitoring?
A bridge is never still. It lengthens in the sun and shortens at night, flexes under every truck, sways a little in the wind, and its foundations settle over decades. Monitoring first records that normal pattern and then watches for movement the pattern can't explain. No single sensor sees all of it, so a bridge monitoring system is a set of sensors chosen for the questions an engineer has about one specific structure.
| Sensor | Where it's mounted | What a change can mean |
|---|---|---|
| Tilt sensor (inclinometer) | Piers, abutments, retaining walls | A foundation is rotating, a sign of settlement or scour |
| Crack meter | Across an existing crack | The crack is growing, not just opening and closing with temperature |
| Displacement sensor | Expansion joints, bearings | A bearing is sticking or a joint is running out of travel |
| Strain gauge | Steel or concrete girders | Load is being carried differently than the design assumed |
| Accelerometer | Deck, usually near midspan | The structure's stiffness or the traffic on it has changed |
| Temperature sensor | On the steel or concrete, plus one in the air | Explains most of the movement the other sensors record |
| Water level sensor | Under the deck, pointing down at the river | The river is high enough for scour to start |
Bridge monitoring accelerometers are the sensors most people picture first. Every bridge has natural frequencies at which it tends to vibrate, and for short and medium spans these are typically a few hertz. A lasting drop in a natural frequency can point to a loss of stiffness, for example from cracking or a seized bearing. Temperature shifts those frequencies too, which is why vibration data is read alongside temperature.
Temperature looks like the least interesting measurement, yet almost every other reading depends on it. Structural steel expands by about 12 millionths of its length for every degree Celsius. On a 100-meter steel span, a 40-degree difference between a winter night and a summer afternoon works out to 100 m × 0.000012 × 40 = 0.048 m, so the deck is roughly 48 millimeters longer in summer. At an expansion joint, that movement would look alarming on its own. With a temperature reading next to it, the software can compare each value with the one it expects at the current temperature, which reveals a real change far sooner than a single fixed limit wide enough to cover both January and July. The expected values come from a baseline period, usually the first few weeks after installation, when the sensors simply record.
How does wireless bridge monitoring work?
Traditional structural monitoring runs a cable from every sensor to a data logger in a roadside cabinet with mains power. On a bridge over a river, laying those cables can mean lane closures and access equipment, and it's often slower than mounting the sensors themselves.
Wireless bridge monitoring removes most of that work. Each sensor is a self-contained unit with its own battery and radio. It wakes up, takes a reading, sends a few bytes and goes back to sleep. Low-power radio networks such as LoRaWAN were built for exactly this pattern, and because the radio is on for only a fraction of a second per reading, batteries typically last years, depending on the model and how often it reports.
The messages go to a gateway, a receiver with an antenna that forwards everything to the monitoring software over Ethernet, LTE or satellite. A LoRaWAN gateway typically covers 2 to 5 kilometers in built-up areas and 15 kilometers or more in open country, so one gateway on a high point can serve several bridges along the same river or road.
In solar bridge monitoring, the panel usually powers that gateway, not the sensors. The sensors already carry their own batteries, but the gateway listens all the time and needs steady power, and many bridges are far from any supply. A panel and battery sized for the shortest days of the year at that location, with reserve for a run of overcast days, keep it running through winter.
One trade-off matters before you buy anything. Low-power radio carries small messages. That suits slow quantities like tilt, crack width, strain, temperature and water level well, but it can't stream raw vibration at hundreds of samples per second. Wireless accelerometers built for these networks do the heavy work on the sensor: they record a short burst of vibration, compute values such as peak acceleration, RMS (a measure of average vibration energy) and the dominant frequency, and send only those numbers. That's enough to follow trends over months. A full dynamic load test still uses a cabled logger with its own power.
How does bridge flood monitoring work?
Scour is the erosion of sand, gravel and soil from around piers and abutments when fast water flows past them. Studies for the US Federal Highway Administration have identified it as the most common cause of bridge failures in the United States. Two things make it hard to catch. It happens during floods, when nobody can safely inspect the foundations. And as the flow drops, the hole often refills with loose sediment, so a diver checking afterward can find a riverbed that looks normal while the foundation has lost part of its support.
Bridge flood monitoring watches for scour from two directions. A radar or ultrasonic sensor under the deck measures the distance down to the water, and the software converts that into a river level. High water isn't damage by itself, but the record shows when scour conditions existed, for how long and at which bridges. Tilt sensors on the piers show how the structure responds while the water is up. Some projects also bury float-out devices in the riverbed at known depths: small transmitters that float up and start sending once the flow has washed away the soil above them, which shows how deep the scour reached. The reading engineers act on combines the two: a pier that tilts while the river is high.
How to set up automated bridge monitoring
Automated bridge monitoring turns readings into a few rules, each tied to something a person should do when it fires. Take, for example, a bridge over a river that normally sits at 1.2 meters on the gauge:
- Run a baseline for a few weeks, so each pier has a known normal tilt at each temperature.
- Treat 3.0 meters as flood level. When the river stays above it for more than 15 minutes, raise a medium-severity alarm to the inspection team.
- While the river is above 3.0 meters, compare every pier's tilt with its expected value. If any pier moves more than the agreed amount and stays there for 30 minutes, raise a critical alarm to the engineer on call.
- If nobody acknowledges the critical alarm within 15 minutes, notify a deputy, then the bridge manager.
The durations in steps 2 and 3 do as much work as the thresholds. A heavy truck crossing during high water can produce a short spike in tilt, and a condition that has to last filters that spike out while still catching a pier that has moved and stayed moved.
In Kilo, step 3 becomes a single rule whose trigger watches the tilt sensor on every pier, checks each pier on its own and uses the reading from the one river level sensor in every check. Its "only if it lasts" timing is set to 30 minutes, so a passing truck doesn't count. The alarm the rule raises follows an escalation chain, which is step 4: the engineer on call first, then the deputy, then the bridge manager, each after its own delay. If you also look after buildings, you can set up the same kind of rules for building vibration monitoring, from rooftop fans and pumps to the structure itself.
Bridge monitoring FAQ
Can bridge monitoring replace visual inspections?
No. Inspection schedules are set by national rules and still apply: in the US, routine inspections of most highway bridges may be no more than 24 months apart, and in Germany the DIN 1076 standard calls for a major inspection every six years with a simpler one three years after it. An inspector also sees what sensors don't measure, such as spalling concrete, rust staining or a damaged railing. Monitoring gives the inspector months of data and a shortlist of places to look first.
How often do bridge monitoring sensors take readings?
Slow quantities such as tilt, crack width and strain are commonly read every 10 to 60 minutes, and a river level sensor every few minutes. Accelerometers usually record short bursts several times a day and report the computed results. Every shorter interval costs battery life, so the battery figure a datasheet gives for your chosen interval is the one to plan replacements around.
What is bridge structural health monitoring?
Structural health monitoring, or SHM, is the engineering name for measuring a structure's condition continuously and interpreting the data. Bridge monitoring is SHM applied to bridges, and the same methods are used on buildings, tunnels, dams and wind turbines. Large cable-supported bridges are often built with a permanent system from day one, Hong Kong's Tsing Ma Bridge being a well-known example since it opened in 1997, while smaller bridges are usually retrofitted with a handful of wireless sensors.
Can bridge monitoring predict when a bridge will fail?
Not as a date. What it gives engineers is measured evidence of change, such as a crack that widens a little more each month or a natural frequency that drifts lower over a year. Many owners tie their alert levels to an agreed action plan, often labeled green, amber and red, where amber means an engineer reviews the data and red means someone goes to site or traffic is restricted.
Take one river bridge and fit tilt sensors to the two piers standing in the water and a level sensor under the deck, with a single rule that raises the critical alarm when a pier moves while the river is high. Kilo's free plan carries that setup, and the first flood season gives the engineer a measured baseline for both piers. Kilo Electronics stocks tilt sensors for the piers, though any compatible LoRaWAN tilt sensor works, and the hardware is paid for separately from the platform.