
Dashboards
The IoT dashboard that shows every site live
Assemble widgets from any device, encode your thresholds in color, and watch values update the moment a sensor reports — no page refresh, ever. From a laptop to a control-room wall.
app.kiloiot.io · Dashboards
Real productReal-time data
An IoT monitoring dashboard that never asks you to refresh
A persistent connection between your browser and the platform pushes every new reading straight to the widgets that display it. A sensor reporting every 60 seconds updates your dashboard every 60 seconds — the latency is your device’s reporting interval, not the platform’s.
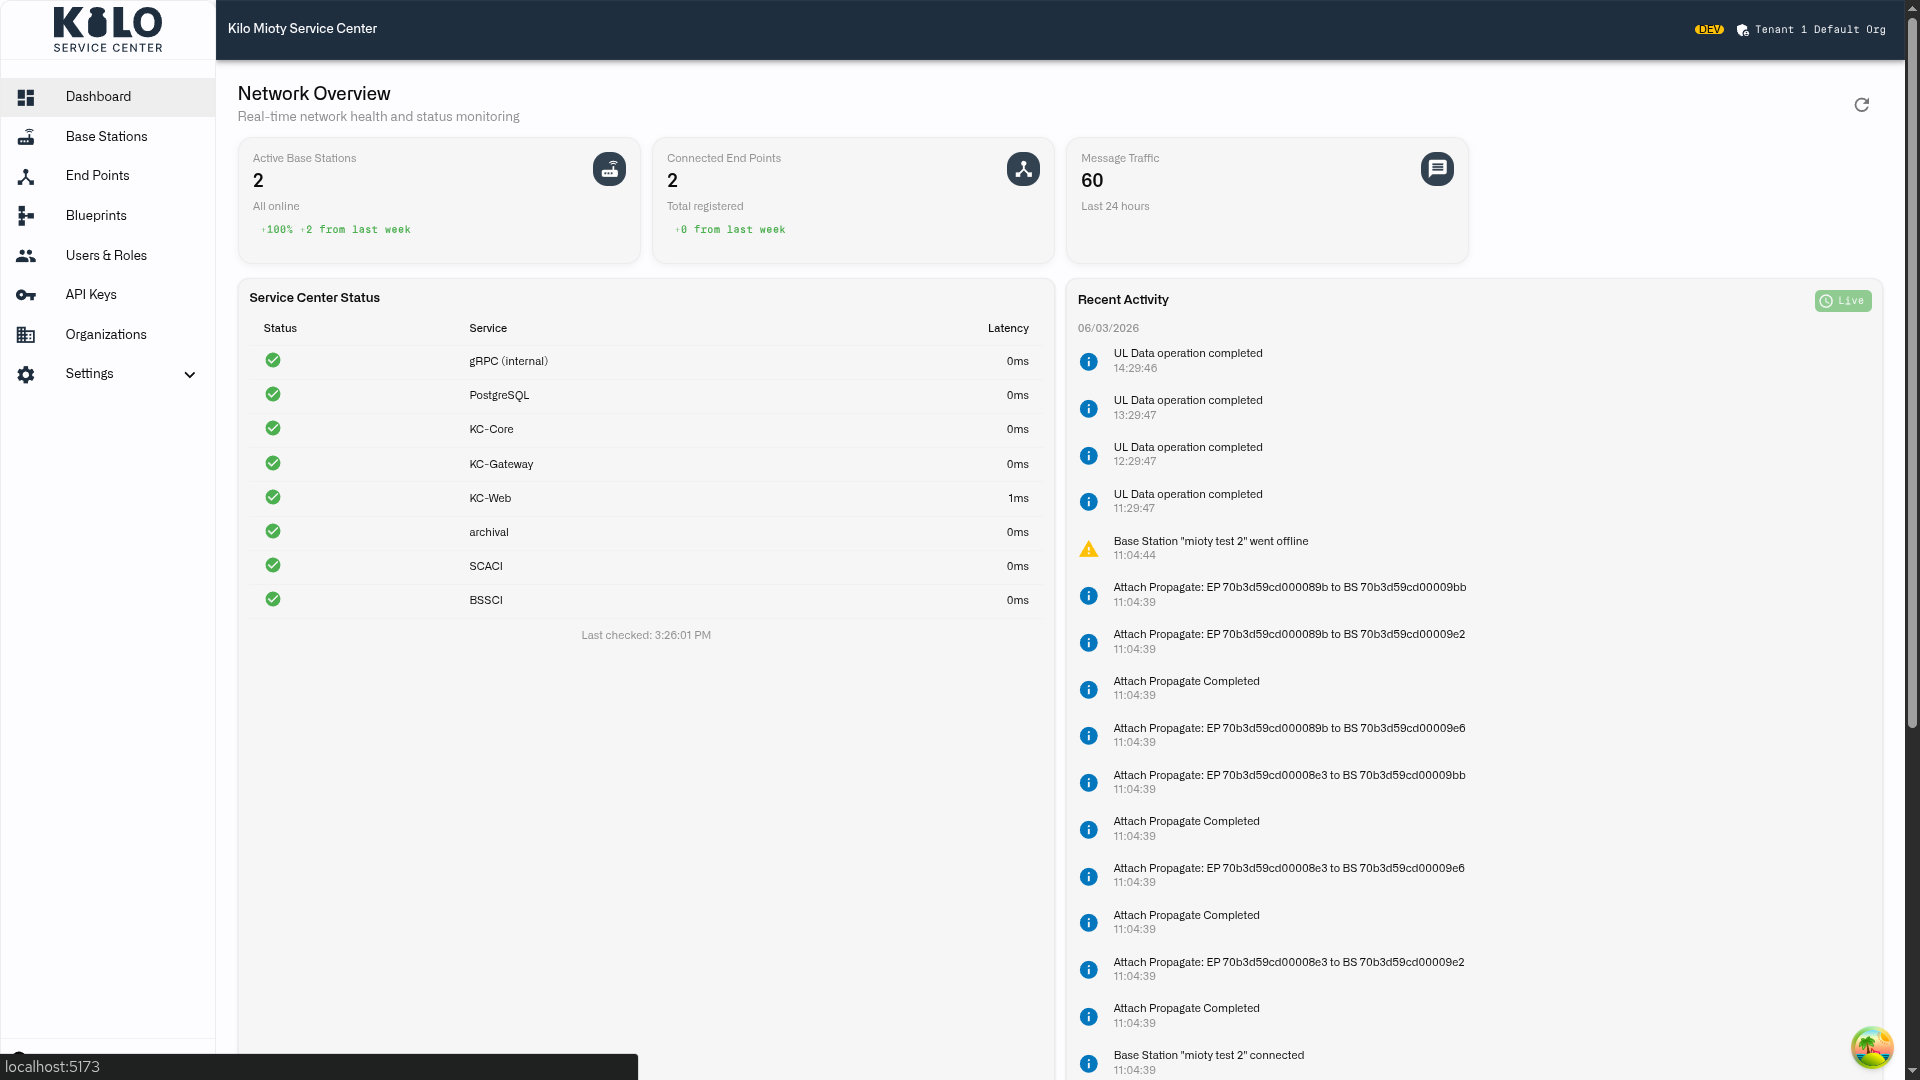
The Live Data indicator in the dashboard header confirms the stream is on. And integrators building external screens can consume the same live feed over SSE and WebSocket.
- New readings appear without a page reload
- Live Data indicator in every dashboard header
- SSE and WebSocket streams for your own integrations
The widget suite
A widget for every question your operation asks
Every dashboard is assembled from widgets — connect them to any device, style them, and give each number its operational meaning.
Last Data
The latest reading, styled to fit: plain value, doughnut, pie, tube, gauge, or radial gauge — several sensors in one tile.
Chart
History as a line or bars with the live reading on top, threshold bands drawn on the graph, and an optional average line.
Map
A GPS-reporting asset on a live outdoor map, one metric on the marker — plus route history for any date range.
Image
Pin live readings onto any floor plan, schematic, or site photo — every value sits exactly where its sensor is.
Text
Headings and notes that turn a dense board into labeled zones a viewer can scan in seconds.
iFrame
Embed a BI report, weather map, or status page from a vetted list of services — right beside your device data.
Control
Switches, buttons, sliders, and inputs that send real device commands — next to the readings that justify them.
Digital Building Twin
A live 3D model of your facility that recolors itself in real time as the sensors bound to it report.
Conditional formatting
Dashboard colors that already know your thresholds
Every metric carries its own condition rules — named ranges like “Compliant”, “Warning”, and “Breach”, each with a color. The widget turns green, amber, or red the moment a reading crosses a line, so operators see status, not raw numbers.
The same sensor can mean different things in different places: 4 °C is green in a cold store and red in a cleanroom. Conditions encode that context per widget.
- First matching rule wins — order sets priority
- Open-ended ranges: “everything above 12” is one rule
- Any unit label — °C, bar, ppm, cm, whatever you measure
- Chart threshold bands color the live headline reading too
app.kiloiot.io · Live dashboard
Dashboards · folder tree
- Building A
- Temperature overview
- Cold chain compliance
- Building B
- HVAC monitoring
- Executive summary
Organization
Folders that mirror your sites — dashboards that stay in order
Group dashboards into folders by building, region, or team, and drag them into the order your operation reads them — the most critical views on top.
Editing is deliberate: view mode stays read-only for daily operation, while edit mode is where you add, drag, resize, and configure widgets. Nothing changes until you hit Save — Cancel discards it all.
- Folder hierarchy for multi-site deployments
- Drag-and-drop reordering of dashboards and folders
- Separate edit and view modes — changes apply on Save
- Drag, resize, and rearrange widgets freely in edit mode
Deploy & share
IoT dashboards for the control-room wall, governed per user
A dashboard is only useful where people actually look — and only safe when the right people can change it.
Full-width wall display
Collapse the sidebar to icons and the dashboard takes the full width of the screen — made for operations-center walls, lobby screens, and factory-floor workstations that stay on all shift.
- One click collapses navigation to icons only
- Live facility status across all sites, hands-free
- Compliance views that stay visible and current
Per-user access control
Access is attribute-based (ABAC) and set per person: give someone Edit on dashboards, View only, or No access at all — with different permissions in every organization they belong to.
- Edit / View / No access, per user
- Scoped per organization
- Stakeholders see everything, change nothing
Planning a monitoring wall or a multi-site rollout? Let’s walk through your dashboard setup together.
Book a callKeep exploring
The platform behind the dashboard
FAQ
IoT dashboard FAQ
Does the IoT dashboard really update in real time?
Yes. A persistent connection pushes each new reading to your open dashboards the moment a device reports — no page refresh. The Live Data indicator in the header confirms the stream, and update latency equals your device’s reporting interval.
Which widgets can I put on a dashboard?
Last Data (value, doughnut, pie, tube, gauge, radial gauge), Chart with threshold bands and an average line, Map with route history, Image with live pins on any floor plan or photo, Text, iFrame embeds, Control widgets that send device commands, and a 3D Digital Building Twin.
How do I organize dashboards across many sites?
Group them into folders by building, region, or team, and drag-and-drop to reorder both folders and dashboards. One folder level keeps the sidebar predictable, and clear naming — site plus function — makes any view findable.
Who can see or edit a dashboard?
Access is attribute-based (ABAC) and set per user: Edit, View, or No access on dashboards, scoped per organization. The same person can hold different permissions in each organization they belong to.
Your sites, live on one screen
Connect a device, add a widget, and watch the first reading arrive — free for 5 devices, no payment details.