
 English
 Français
 Español
 Deutsch
 Português
 Italiano
 العربية
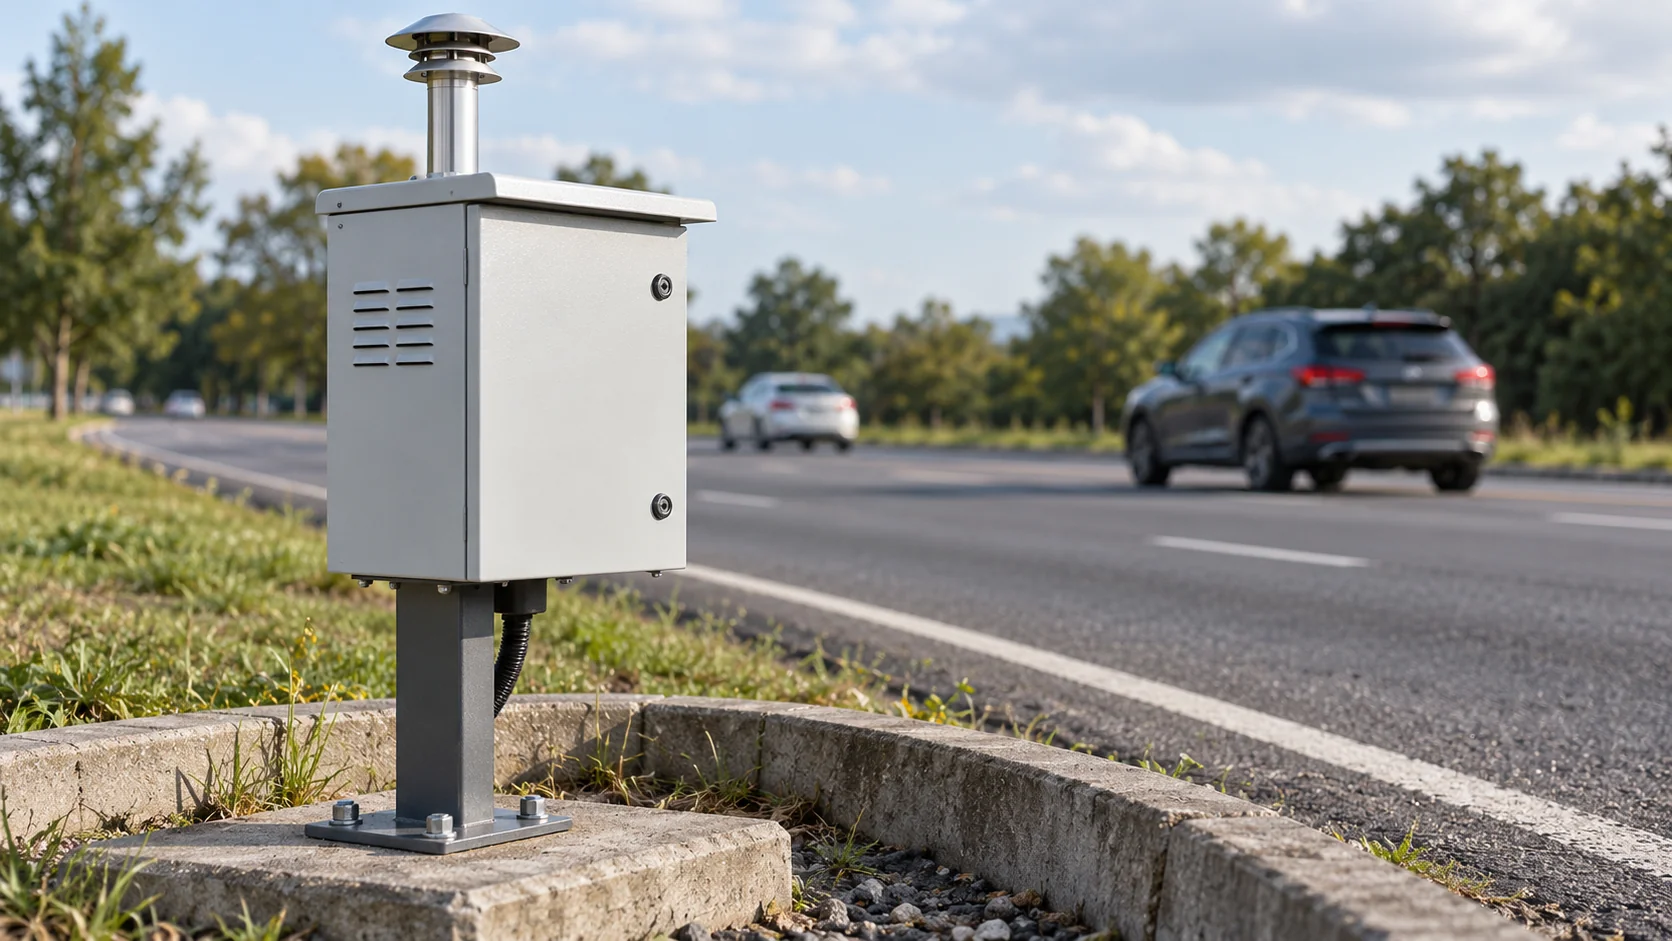
Outdoor air quality monitoring is the continuous measurement of pollutants in the air people breathe outside, mainly fine particles, nitrogen dioxide and ozone, so that cities, regulators and industrial sites know how polluted the air is, where, and when. It feeds public air quality indexes, compliance reports, health warnings and, increasingly, the day-to-day decisions of construction sites and plants with neighbors.
Official networks are precise but sparse: a large city may run only a handful of regulatory stations. Cheaper sensors can fill the gaps, and they're the reason so many councils, schools and companies now run their own networks. What matters is knowing what each kind of equipment can and can't tell you.
In short
- Regulatory air quality monitoring stations use reference methods and are accurate, but expensive and few.
- Low-cost sensor nodes add many more measurement points, with lower and more variable accuracy that needs calibration.
- A good air quality monitoring system starts from the question it has to answer: compliance, public information or site control.
- The software has to collect mixed devices, flag bad data, calculate averages, alert and publish.
What is an air quality monitoring station?
An air quality monitoring station is a small climate-controlled cabin or cabinet with sample inlets on the roof and analyzers inside, each measuring one pollutant by a defined method. In the EU, the reference methods are set out in European standards: chemiluminescence for nitrogen dioxide (EN 14211), ultraviolet photometry for ozone (EN 14625) and weighing particles collected on filters for PM10 and PM2.5 (EN 12341), with automated particle monitors allowed when they're shown to be equivalent (EN 16450). The US Environmental Protection Agency has a similar system of Federal Reference and Equivalent Methods.
Stations are classified by what they represent. A traffic station sits close to a busy road and shows what pedestrians and residents next to that road breathe. An urban background station is placed away from any single source and shows the general level across a neighborhood. Industrial stations sit near a plant. The same city can show very different numbers depending on which kind you read, which is why a single "air quality for the city" figure always hides detail.
The accuracy comes with a cost. Stations need mains power, air conditioning for the analyzers, gas cylinders for calibration, regular site visits and trained staff to validate the data before it's reported. That's why even well-funded cities run only a few, and why a station can tell you precisely what happens at one corner but nothing about the street two blocks away.
Station data also goes through two stages that surprise first-time readers. Numbers published within the hour are provisional: they come straight from the analyzers and may still contain faults. Months later, after calibration records and site audits have been checked, the data is ratified, and some values change or are removed. Official annual reports use ratified data, which is why a station's live figures and its yearly result don't always match.
Low-cost air quality monitoring vs reference stations
Low-cost sensor nodes measure the same pollutants in a box the size of a lunchbox, at a small fraction of a station's price. They use different physics. Particles are usually counted with an optical sensor, which shines a laser through a small airflow and estimates particle size and mass from the scattered light. Gases are measured with electrochemical cells or metal-oxide sensors, which react chemically with the target gas.
| Reference station | Low-cost sensor node | |
|---|---|---|
| Measuring principle | Reference or equivalent methods | Optical particle counting, electrochemical or metal-oxide gas cells |
| Accuracy | High and documented | Indicative; varies by model, pollutant and weather |
| Calibration | Automatic checks plus calibration gases and site audits | Co-location with a reference station, then periodic checks |
| Power and data | Mains, wired or cellular | Battery or solar; low-power radio, Wi-Fi or cellular |
| Typical use | Compliance, official indexes | Dense networks, hotspots, site warnings, public engagement |
The weaknesses of cheap sensors are well known and manageable once you know them. Optical particle sensors tend to read high in very humid air, because water droplets get counted as particles. Electrochemical gas sensors drift over months and can react to gases other than their target; many nitrogen dioxide sensors also respond to ozone. The standard remedy is co-location: run the sensors next to a reference station for a few weeks, derive a correction, then deploy them and check them again later. Budget for replacements too: electrochemical cells are consumables that wear out after a couple of years in many models, and an optical sensor's fan and laser have a finite life, so a sensor network is an operating cost as well as a purchase.
Used that way, outdoor air quality monitoring devices answer questions stations can't: which street near a school is worst at drop-off time, whether dust leaves a construction site or comes from the road outside it, and how a new traffic scheme changes pollution across a district. The EU's air quality rules also recognize "indicative measurements" with looser data quality objectives than fixed reference measurements, which is a useful way to think about them: sensor networks give indicative data, while stations remain the evidence for compliance.
What should air quality monitoring software do?
Air quality monitoring software sits between the devices and the people, and it has more to do than draw charts. It should accept data from different makes of sensor and station, keep the raw readings, calculate rolling and fixed averages, flag implausible values such as a sudden drop to zero, show locations, and send alerts when averages pass a threshold. If the data is meant for the public, it also needs a way to publish readings, either through an open data feed or a public page.
Publishing usually means an index rather than raw concentrations, because most people can't interpret "38 micrograms per cubic meter". The US Air Quality Index uses six color-coded categories, from 0 to 50 for "Good" up to 301 and above for "Hazardous", and takes the worst of several pollutants as the headline figure. The European Environment Agency's European Air Quality Index uses six bands from "good" to "extremely poor". If a city or site publishes its own data, using the same scale as the official index for that country avoids confusing residents who check both.
How does an air quality monitoring system work?
An air quality monitoring system is the whole chain: sensors in the right places, a way to get their data out, software that turns raw readings into averages, and people who act on the results. Designing one usually follows these steps:
- Write down the question. "Are we within the legal limit?" needs reference instruments. "Where is the worst air near our schools?" needs many sensors. "Is our site sending dust over the fence?" needs sensors at the boundary plus wind data.
- Choose locations to match. Put fence-line sensors downwind of the likely source and one upwind for comparison. For street monitoring, the revised EU directive places sample inlets between 0.5 meters, the breathing zone, and 4 meters above the ground.
- Add weather. Wind direction and speed explain most of what a fence-line sensor shows, and humidity is needed to correct particle sensors.
- Decide the averaging periods. Limits are usually set as hourly, daily or annual averages, so the system has to compute the same.
- Set thresholds and responses. Decide who is told, and what they do: damp down a haul road, stop a crusher, warn a school.
- Plan maintenance, including sensor replacement and calibration checks.
Here's an example of why steps 3 and 4 matter. A construction site has a dust trigger agreed with the local authority, say an average PM10 level of 150 micrograms per cubic meter over 15 minutes at the boundary. One sensor reports a spike to 400 for two minutes as a truck passes, and the 15-minute average stays at 90: no action needed. Later, the average at the downwind sensor climbs to 170 while the upwind sensor reads 40, with the wind blowing from the site toward the homes. That is a real exceedance, and the source is clear.
Placement can spoil readings from good hardware. A sensor mounted next to a kitchen vent, a generator exhaust or under a dense tree canopy measures its surroundings, not the air you care about. Sensors also need open airflow on all sides and protection from direct rain. Data coverage counts too: the revised EU directive expects fixed measurements of the main gases and particles to cover at least 85% of the year, a reasonable target for any network whose data will feed decisions.
Limits are also getting tighter. The revised EU Ambient Air Quality Directive, adopted in 2024, lowers the annual limit values for 2030 to 10 micrograms per cubic meter for PM2.5 and 20 for nitrogen dioxide, moving closer to the World Health Organization's 2021 guidelines of 5 and 10. More cities will need more measurement points to show where they stand.
What is the best air quality monitoring software?
For a network of low-cost sensors, the software matters most in three places: taking readings from mixed makes of sensor, telling a real exceedance from a momentary spike, and getting a person moving when one happens. Kilo handles all three. You connect battery-powered sensors from different manufacturers over LoRaWAN, mioty or MQTT, and map each maker's raw field names to one normalized metric, so PM10 from one brand and PM10 from another land on the same chart and the same rule. A single LoRaWAN gateway typically reaches 2 to 5 kilometers in a city, enough for a school cluster or a whole site boundary.
A rule's trigger can require a reading to stay above your limit for a set time, anywhere from 10 seconds to 30 days, so the two-minute spike from the passing truck in the example above never raises an alarm, while a boundary sensor that stays high does. The alarm then moves through an escalation chain: the site supervisor first, then the project manager if nobody resolves it in time.
None of this turns a low-cost sensor into a reference instrument: the readings stay indicative, and compliance still rests on reference stations. For a district, a school route or a construction boundary watched with indicative sensors, though, mixed-sensor intake, time-based triggers and escalating alarms make Kilo the best air quality monitoring software to run the network on. The environmental monitoring page shows how the same battery sensors, live dashboards and escalating alarms cover temperature, humidity, CO₂ and air quality, water and soil.
Air quality monitoring FAQ
What pollutants does air quality monitoring measure?
The core list under EU and US rules is fine particles (PM2.5), coarser particles (PM10), nitrogen dioxide, ozone, sulfur dioxide and carbon monoxide, with benzene, lead and other metals measured at fewer sites. The revised EU directive also requires ultrafine particles to be measured at monitoring "supersites" and at selected locations where high concentrations are likely, to build a better understanding of their effects on health.
Is outdoor air quality monitoring required by law?
For governments, yes: EU member states must assess air quality across defined zones, and US states run monitoring networks under the Clean Air Act. Private sites are usually required to monitor only when a permit, planning condition or contract says so, which is common for large construction, quarrying and industrial projects.
How often should air quality monitoring sensors be calibrated?
Reference analyzers typically run automatic zero and span checks, often daily, with full calibrations and audits on a fixed schedule set by the network's quality plan. Low-cost sensors should be checked against a reference instrument before deployment and again at intervals, and earlier if their readings start to diverge from nearby sensors of the same model.
You can set up the fence-line method from the example on one boundary of a site. Mount three particle sensors along the side facing the nearest homes, one on the opposite side as an upwind reference, and a wind sensor, then add a rule that raises an alarm when a boundary reading stays above your dust trigger for 15 minutes. That's five devices, one dashboard and one rule, which is what Kilo's free plan covers, with no payment details and no expiry date. It keeps one day of device history, enough to watch the boundary live and act on alarms; to compare a month of readings against the wind record, the Pro plan at €145 a month keeps a month. Kilo Electronics stocks wind sensors for the wind measurement.